How to configure the Dashboard
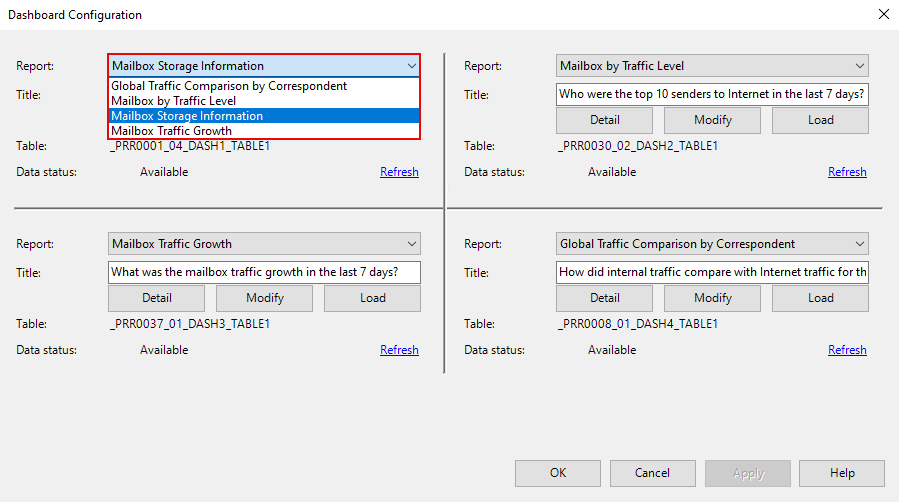
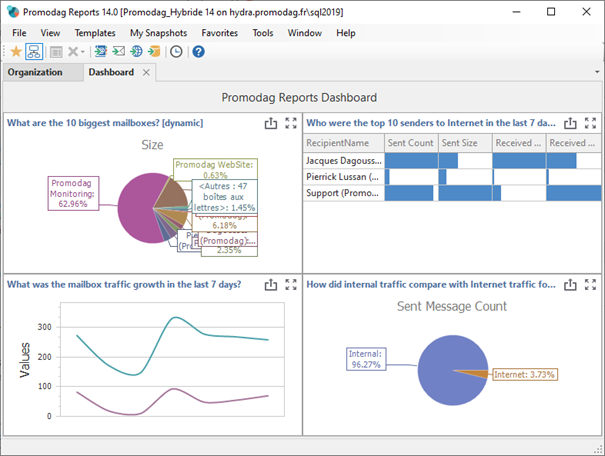
The Promodag Reports dashboard displays the contents of 4 reports from the following report templates :
- Mailbox Storage Information, listing the n largest mailboxes;
- Mailboxes by Traffic Level, listing the n largest senders or recipients;
- Mailbox Traffic Growth, which displays a graph showing the overall volume of mailboxes over a time interval;
- Global Traffic Comparison by Correspondent, which lets you break down traffic by correspondent type (Internet, Internal).
To configure these reports as you wish, use Tools > Dashboard Configuration. Here you can choose the order in which reports are displayed from the drop-down list.

To load a specific favorite, click Load. You can either choose one of the default favorites delivered with Promodag Reports (What was the mailbox traffic growth in the last 7 days? etc.), or one of the customized reports you may have created from this one of the report templates.
Click the Refresh link to generate or regenerate the report data displayed in the dashboard.
To display the dashboard, use View > Dashboard:
To display the dashboard, use View > Dashboard:

Try Promodag Reports Free for 45 Days
